Benchmarks & Trends

Unlocking the Potential of Data

Goal

How might we empower restaurant managers to quickly understand their restaurant's performance and take action to be more successful in a post-COVID world?

Background

About the Users ‐ Restaurant Managers

  • Lightspeed users with permissions to view reports
  • They're very busy - they don't just work 9-5
  • They wear many hats - scheduling, managing reservations, helping expedite food, ordering inventory, etc.
  • They come from varied backgrounds - some have business degrees and come from tech, some have been in Hospitality their whole life

How Can We Innovate?

Upserve Inc. was acquired by Lightspeed in part for their data capabilities. As a new member of the Lightspeed family, how can we leverage that power to provide a best-in-class product? We have access to lots of hospitality data both in and out of our network (data on guests, staff, market, etc). We can use this to inform our users on how their performance compares to other restaurants like them, forecast trends, provide recommendations, and much more.

Current State of Our Products

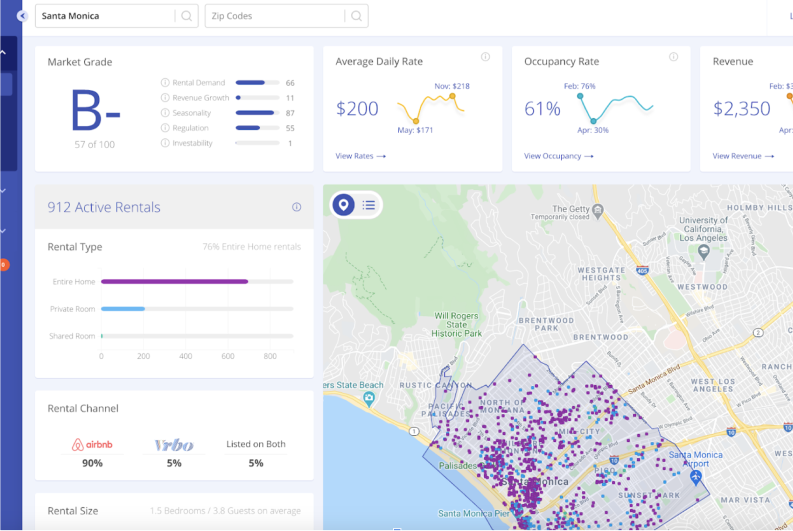
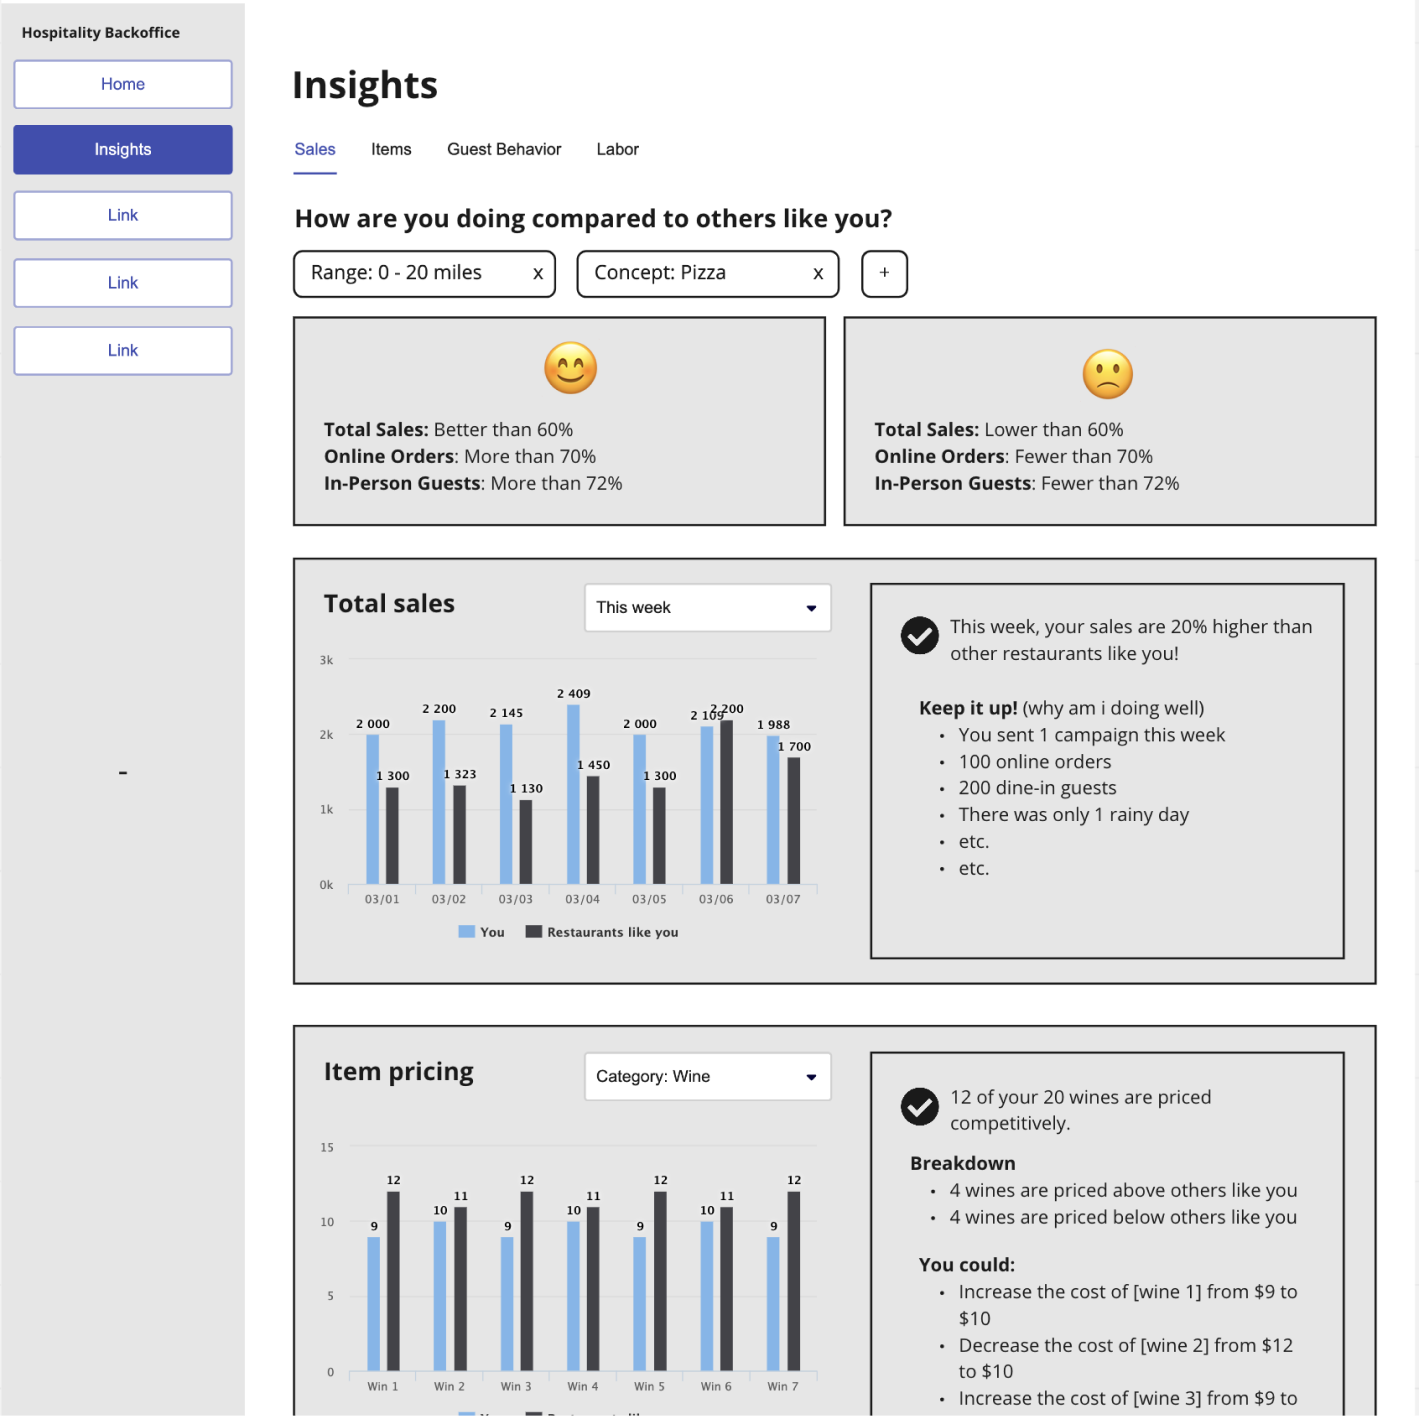
We offer several different Analytics products featuring robust dashboards and customizable reports. They have a steep learning curve, and users need to sign into multiple products to get a full picture. We can do better to make sense of all this for users and give them the "so what".

Lightspeed Quote

"I am not a data scientist, and I can't afford to hire one. I need you to tell me what to do."

Lightspeed Customer

How Might We

enable busy restaurant managers to...

  • compare restaurant performance against similar restaurants?
  • identify trends inside and outside their restaurant's market?
  • improve performance based on our recommendations?
  • trust the data they're seeing, so they feel empowered to make changes?

Timeline & Scope

  • Start: March 2021
  • Handoff: Q3 2022
  • Technology can be a brand new, standalone product, so not tied to existing architecture or technology.
  • Responsive Web
  • iOS app is out of scope for now

The Team

  • Product Design
  • Data Science — collaboration beyond pulling data
  • Product
  • Engineering
  • Content Design

My Role

  • Guided problem definition
  • Championed discovery research
  • Conducted user interviews
  • Launched & analyzed in-app surveys
  • Facilitated collaborative workshops
  • Designed all wireframes and hi-fidelity prototypes

Market Research

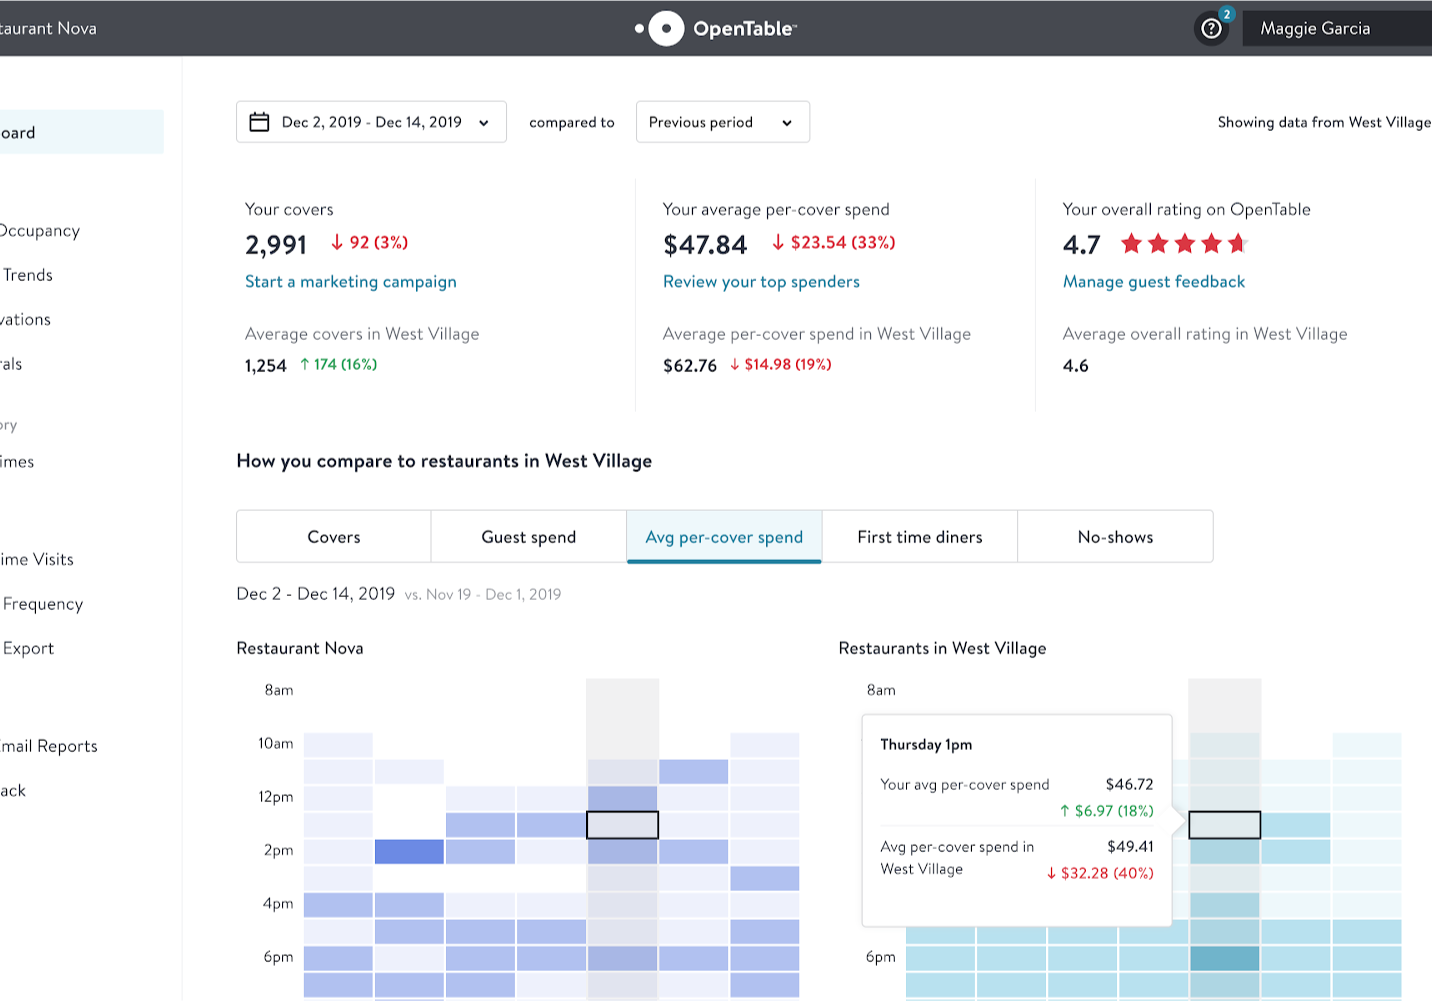
To get a sense for how other restaurant software providers were addressing user benchmarking needs, I led up market research for direct and indirect competitors. We found that only OpenTable had a benchmarking product which allowed restaurant managers to view their restaurant's performance and how it stacks up against similar restaurants in the same area. Most other direct competitors offered an Analytics tool, but no way to distill and compare the data to provide actionable recommendations.

OpenTable Reference
OpenTable

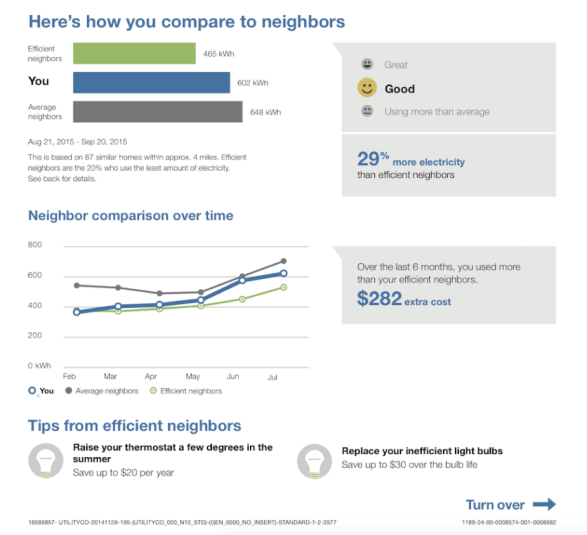
Indirect competitors had a lot more relevant inspiration:

  • AirDNA - offered tools for property managers to compare their listing to similar ones so they can get a sense for pricing, amenities, rental density and more.
  • National Grid - sends out a monthly usage report to clients which highlights how their energy usage compares to neighbors. The report does a good job at keeping it simple, calling attention deserving areas, and uses conventional graphics to make it user-friendly.
AirDNA Reference
AirDNA
National Grid Reference
National Grid

User Interviews

To better understand user needs and how restaurateurs go about gauging their restaurant's performance today, I took the lead on user interviews:

  • Writing scripts
  • Recruiting and scheduling participants
  • Conducting sessions
  • Inputting and tagging in Dovetail
  • Synthesizing and sharing insights with greater teams

We conducted 6 interviews with a mix of customers from different segments. From these interviews, we were able to capture powerful clips from real users to help refine our problem statement, understand post-COVID hardships, and see where we can provide the most value.

User Interview Quote

"We'd really need to compare apples to apples and research their dishes to see why pricing might be different."

— Coffee Shop Customer, TX

Survey

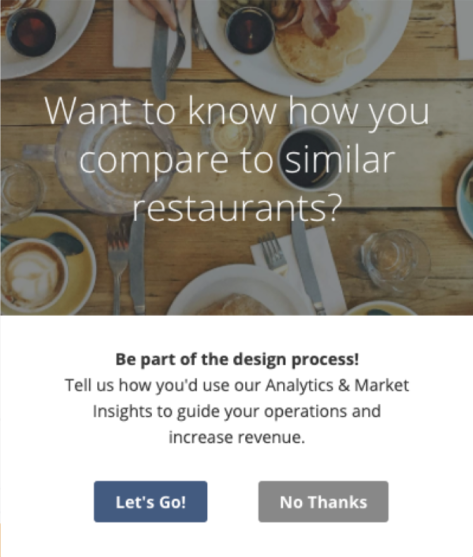
With themes starting to bubble up from our user interviews, it was important to validate with a greater audience to gain confidence and conclusivity. I was empowered to launch an in-app survey using Intercom to quickly get responses to some of our burning questions.

Responsibilities included:

  • Writing and reviewing outlines with team
  • Building & launching survey and in-app popup
  • Analyzing results
  • Inputting and tagging in Dovetail
  • Synthesizing and sharing insights with greater teams

Within 4 days of launch, we received ~1,600 responses validating pain points as well as my outreach techniques.

Survey
Survey

Design

Hosting Collaborative Workshops

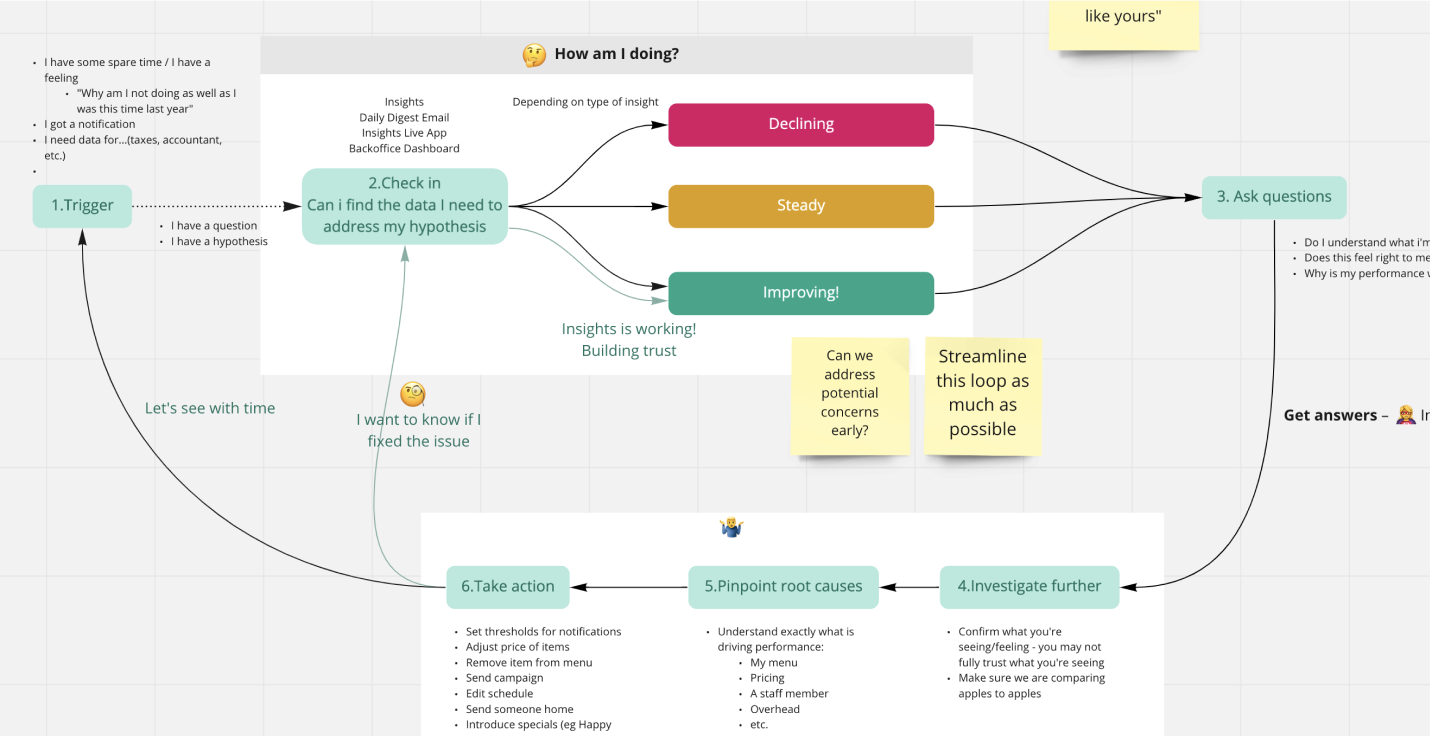
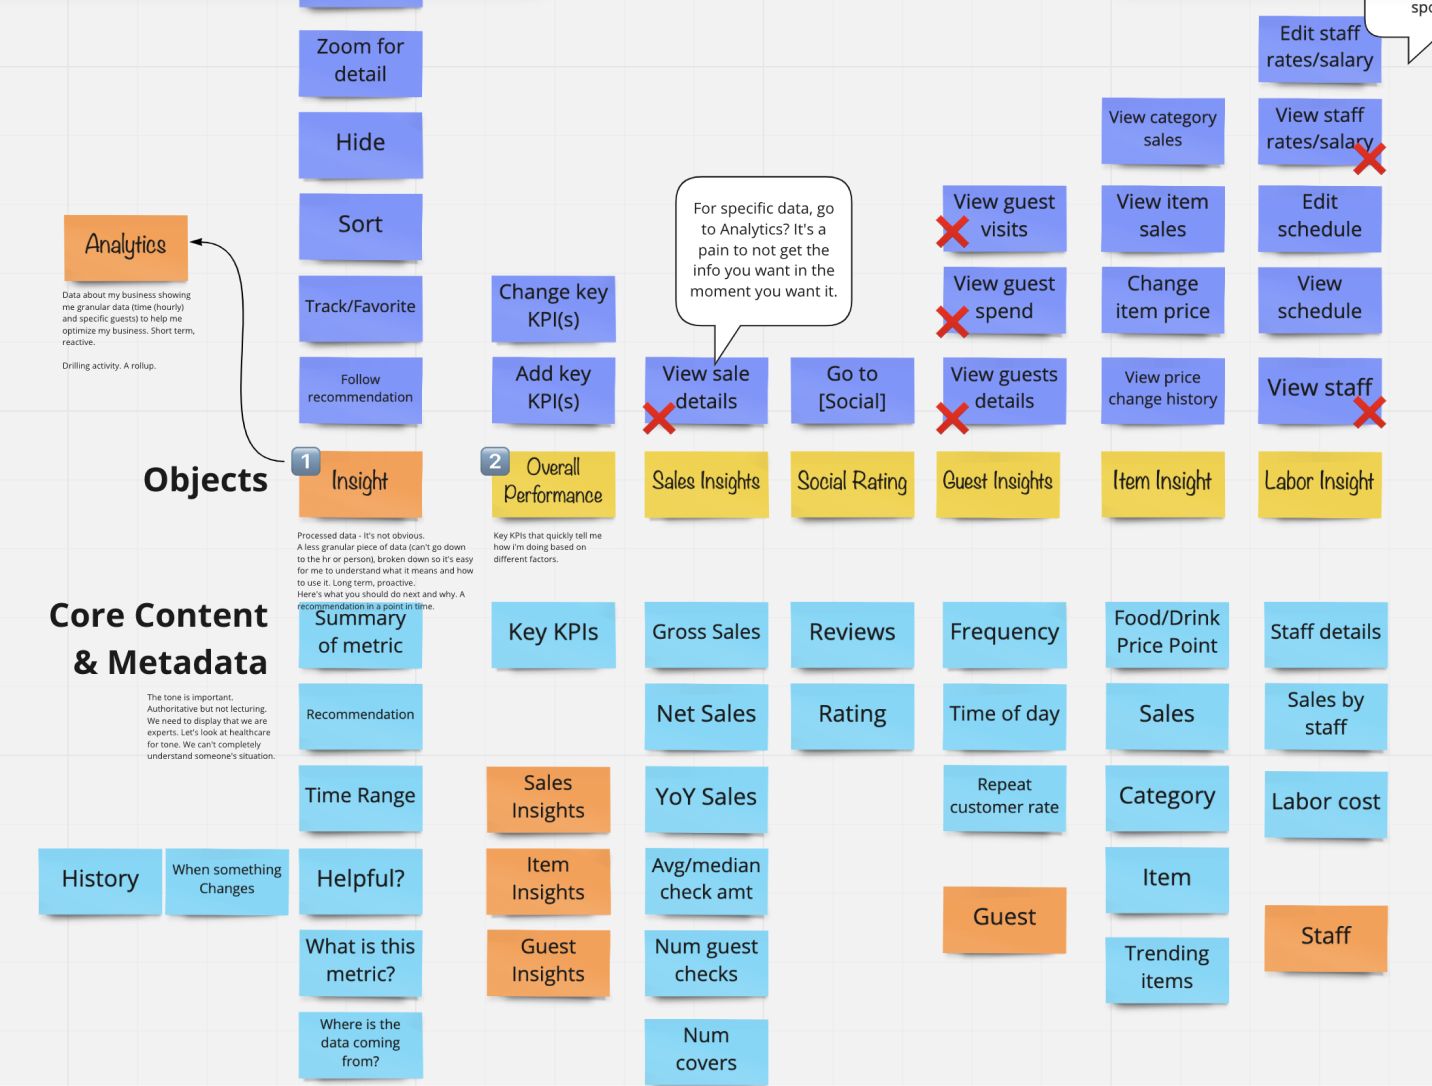
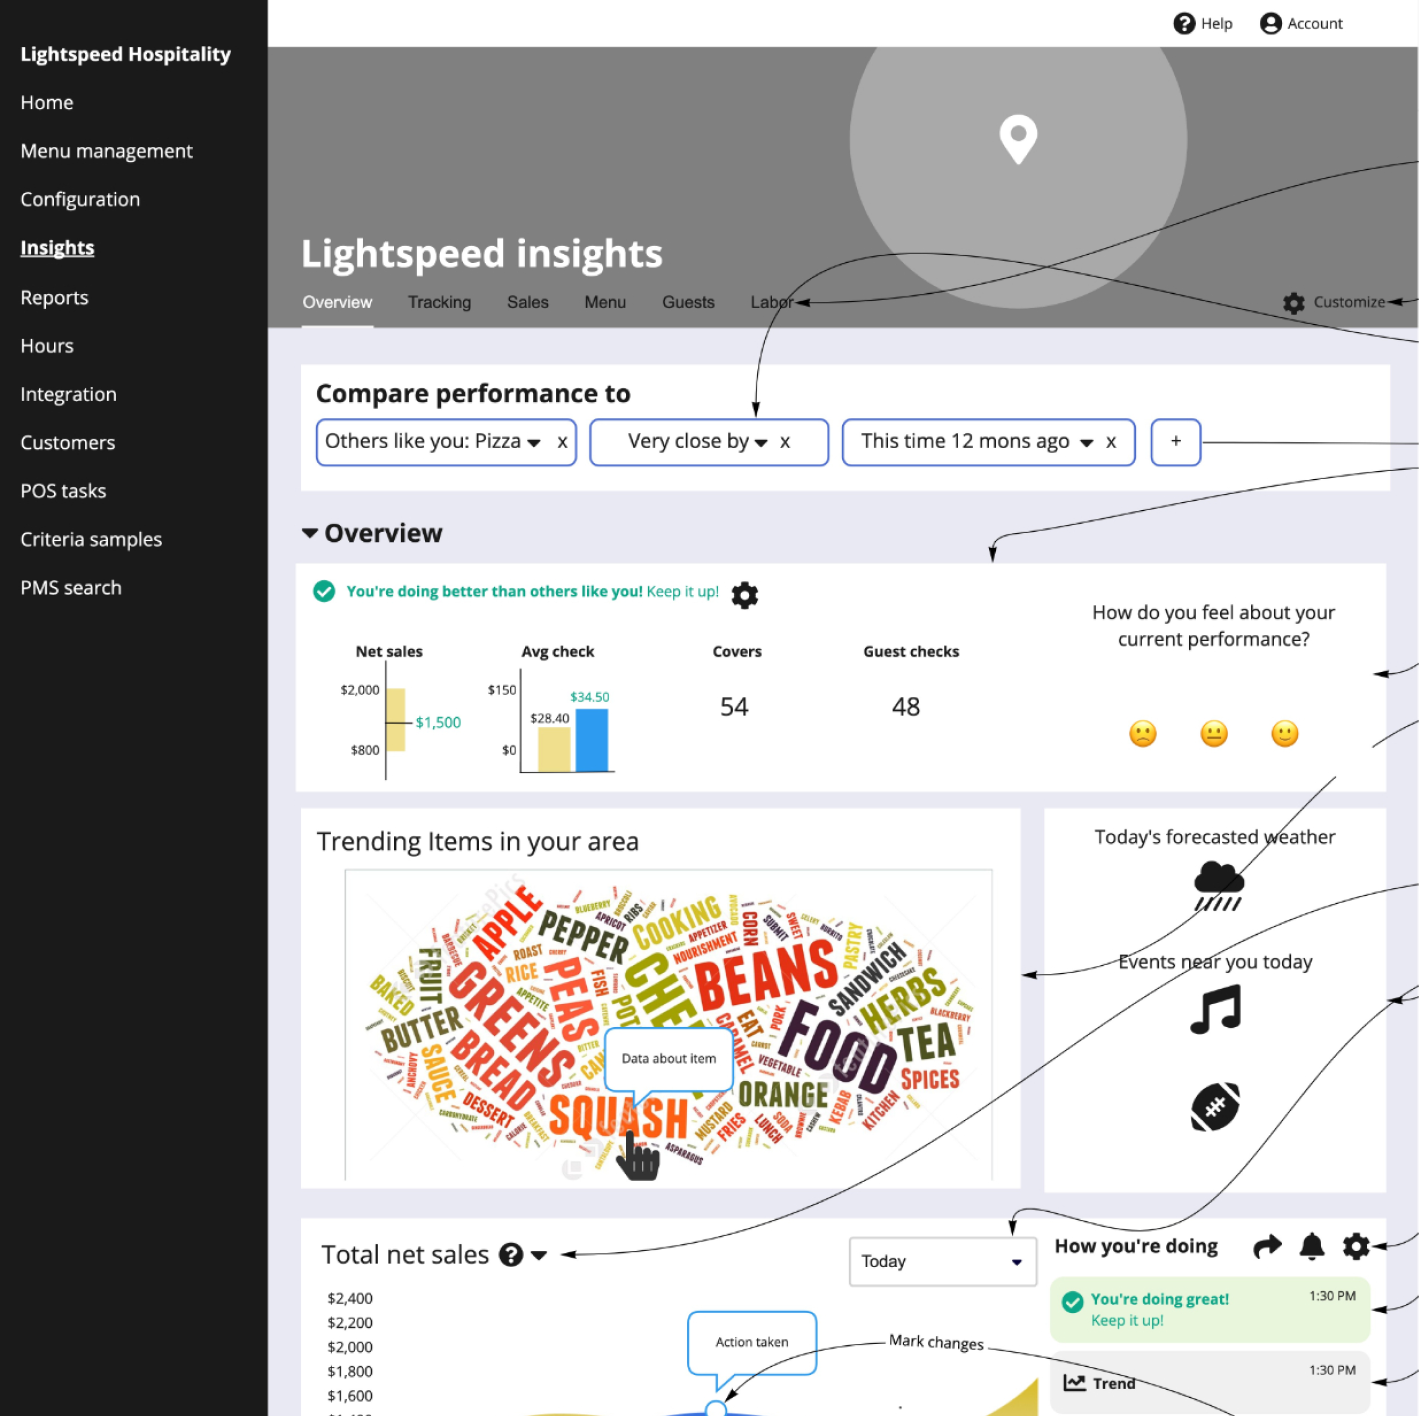
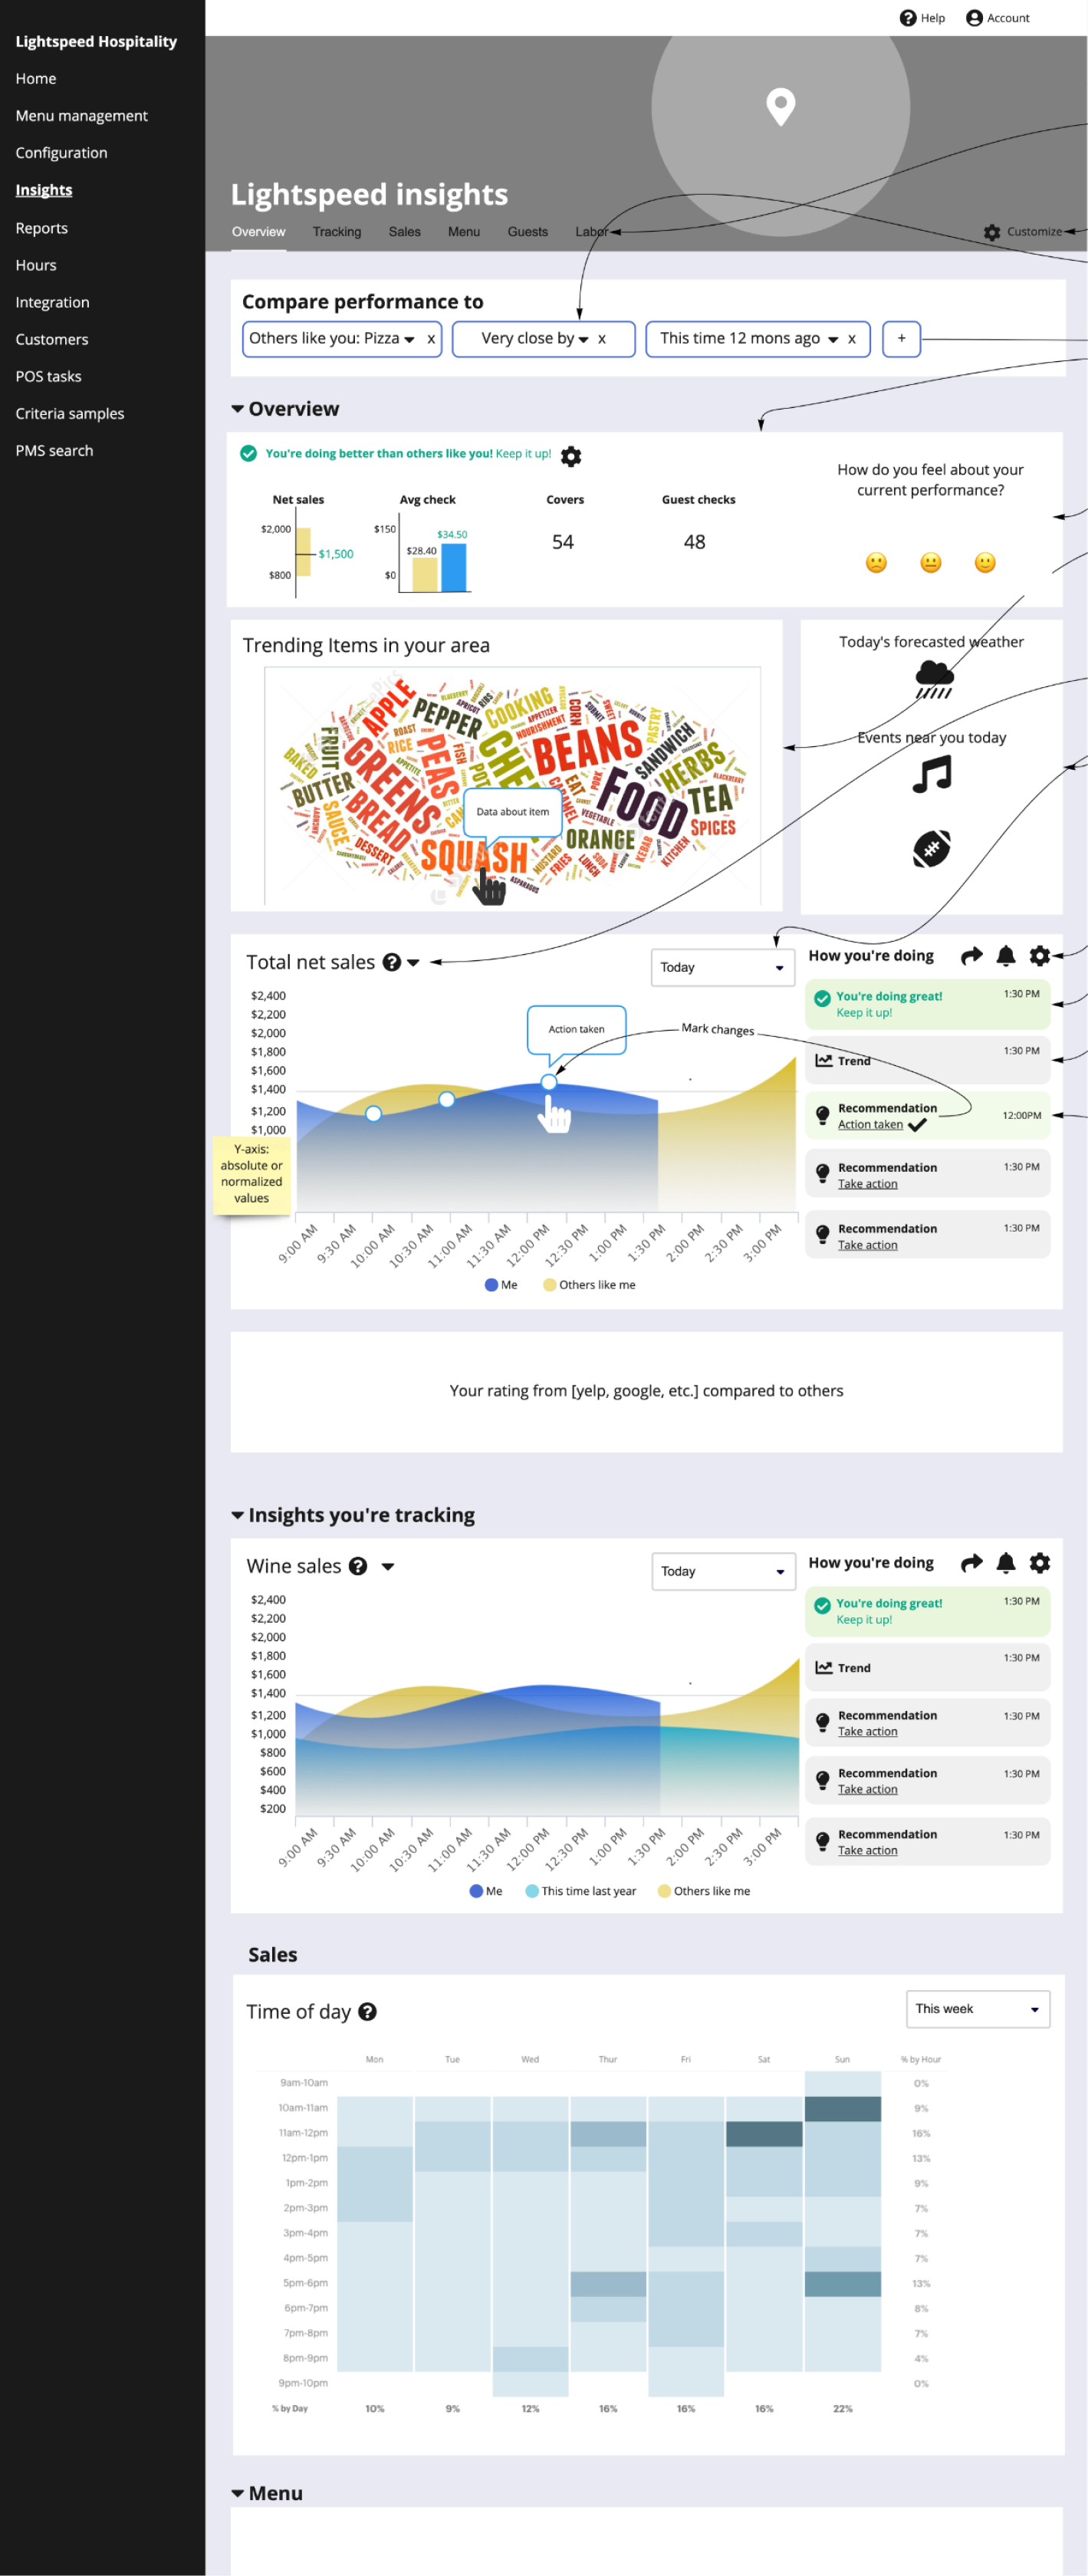
With research helping to guide our vision, we were ready to start fleshing out ideas and better understanding the ins and outs of a possible feature. I led several collaborative sessions with cross-functional team members including the Head of Hospitality Product, Product Managers, Engineers, lead Data Scientist, and Content Designer.

  • Object Oriented UX (OOUX) - understanding and aligning on our core components of the feature
  • Whiteboarding - mapping out user flows, imagining happy paths, organizing ideas in affinity diagrams and more
  • Wireframing - loosely iterating on ideas as a team to gain alignment quickly
Wireframing
Journey Mapping
Wireframing
OOUX
Wireframing
Wireframing
Wireframing
Wireframing

Final Designs

Design Considerations & Decisions

  • Users are willing to share their information if they get something in return
  • Net sales is primary KPI
  • Provide actionable insights
  • Use recognizable performance conventions 
(e.g. red/green, icons, grading system)
  • Need to build confidence in our data models to accurately forecast
  • Visualizations:
    • Simple
    • Tell a story
    • The power of repetition
    • Heatmaps resonate with our users

Challenges

  • Maintain user privacy
  • Ensure we're comparing “apples to apples”
  • What if there are no similar businesses in your area?
  • Data models are fairly simple at the moment
  • We want to start incorporating our new Design System

Outcomes

Me and my Data Science partner presented this work at our Product & Technology Summit to spotlight our collaboration and problem solving strategies to the greater team.

As of Sep 2022 (my departure), this project was still being worked on.